
What I have used it for.
I can allow clients to login, see their bills, track credit usage and keep tabs on the progress of tasks that are being worked on.
Why is this useful?
It saves the headache of the constant back and forth between creator and client:
• ’is this ready yet?’
• ‘can I get an update on x?’
• ‘Is our retainer used up yet for this month?’
• ‘Have we gone over on our credits’
…you get the picture.
Solving these problems with a dashboard accessible 24/7 allows conversation to be more meaningful and focussed on creativity which is way more efficient and enjoyable.
Firstly
To begin with you will need the following:
• An Airtable account (available free)
• A Memberstack account (free to start)
• A Webflow account (free to start)
• An Integromat account (free to start)
Part 1. Airtable
The flow:
1. Client requests a task
2. The task gets inputted into the Airtable project tracker (Kanban view)
3. The task is then assigned to a team member and given an amount of hours to complete.
In this example, HiDesign has 4 main data sets for Airtable:
1. Tasks
2. Clients
3. Team members
4. Pricing
For each data set you need a new table in Airtable.

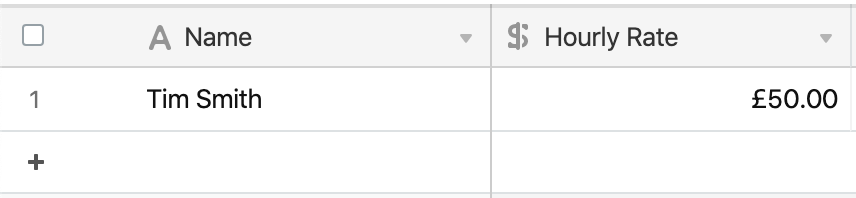
1. Team Members.
To begin our relational database we are going to start with ‘Team Members’. In this example we are going to create two columns for [Name] and [Hourly Rate] and add our first team member
2. Pricing
The second relational database we are going to create is ‘Pricing’. HiDesign works on a credit based system where different services cost a different amount of credits. This is part of our flexible pricing available for all customers. We are going to create two columns, one for the [Service] and one for the amount of credits that service costs per hour.
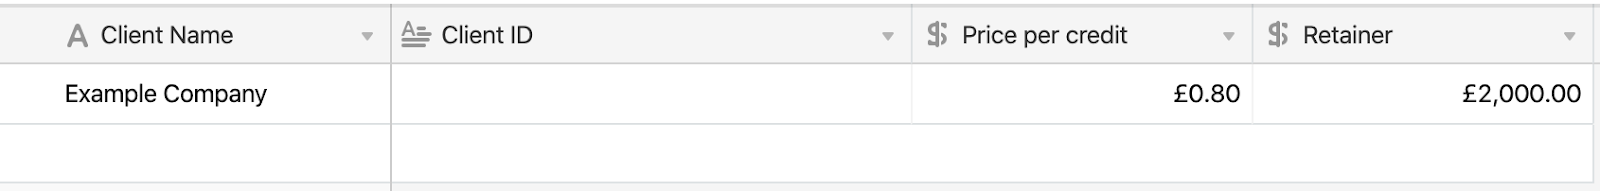
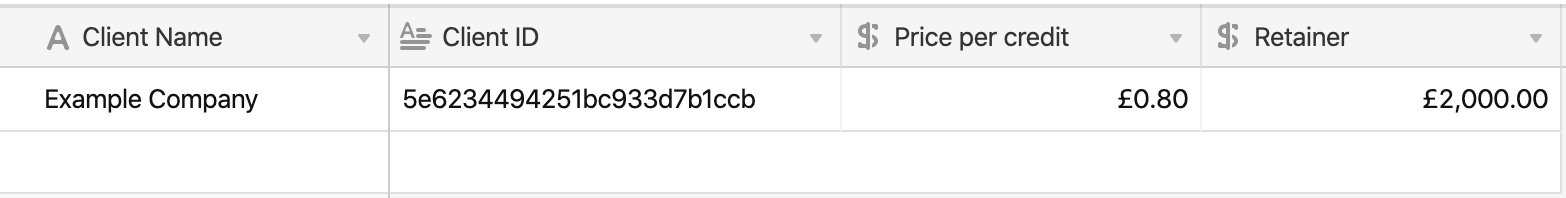
3. Clients

The third relational database we need is ‘Clients’ and the minimum amount of columns we are going to need here are [Client Name], [Client ID], [Price per credit] and [Retainer].
You may have noticed that the [Client ID] column is empty, we’ll come back to that shortly.
4. Tasks
For our final (and most extensive) database we will need the following columns.
When there are lots of data sets, like to break the columns down into:
1. Data that need to be manually entered for each task.
2. Data that can be set from a predefined list (linked to another table)
3. Data that is defined by a formula
So in this case:
1. Data that need to be manually entered for each task.
[Task] - The name of the task
[Hours it will take] - How many hours the client will be billed for the task.
2. Data that can be set from a predefined list.
[Client] - Client that requested the task
[Service] (Link to ‘Pricing’) - The service requested by the client
[Status] (Kanban view) - To do, doing or done
[Invoice Month] (multiple select) - The month for which this task will be billed to the client
[Team member] (Link to ‘Team members’) - The team member assigned to this task
3. Data that is defined by a formula
[Credits] (Link to pricing) - The amount of credits charged per hour for the selected service
[Total Credits] (formula) - [Credits] * [Hours it will take]
[Date Modified] - Last time any column in the row was updated
Part 2. - Memberstack
Memberstack is probably one of the best online tools I have ever come across. They fuel this whole process by providing a seamless integration with Webflow, allowing you to create gated content in Webflow. I’m not going to go into too much detail on how to use it as they have some amazing resources available. If you’re starting from scratch, I recommend you start with this theme as your foundation: https://memberstack.webflow.io/freebies/8-client-dashboard
As it is Webflow, everything is fully customisable and for the purpose of this article using the theme I mentioned will save you a LOT of time due to it pretty much being 95% complete in terms of the backend setup.
Once you have a Memberstack account, move on to part 3.
Part 3. - Webflow
So we have our database, we have Memberstack integrated with Webflow, now we want to display some data in there. The most efficient way of doing this BY FAR, is by using a CMS Item for the client’s info and a CMS Collection Page to display the data. It is important to set this up early on otherwise later down the line you will find yourself juggling different pages for different clients.
Using the CMS allows you to have one page which automatically displays the right data / content tailored for the person who is looking at it.
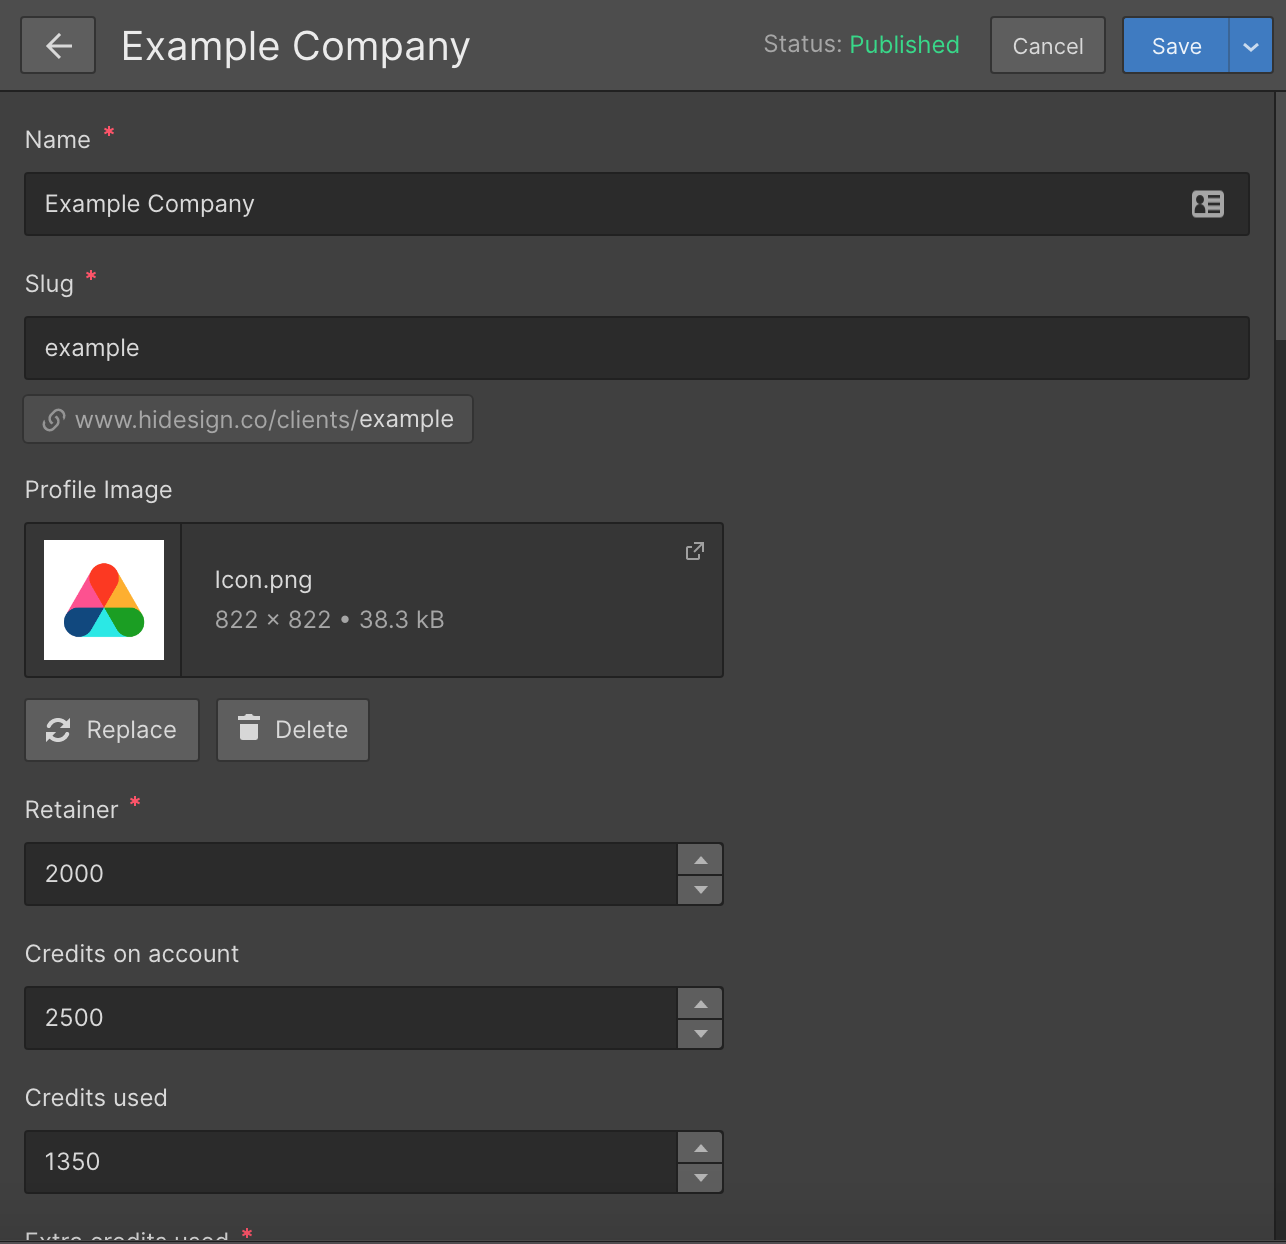
Creating a client CMS item.
The CMS fields we are going to use for clients are:
[Name] - Mandatory
[Slug] - Mandatory
[Profile Image]
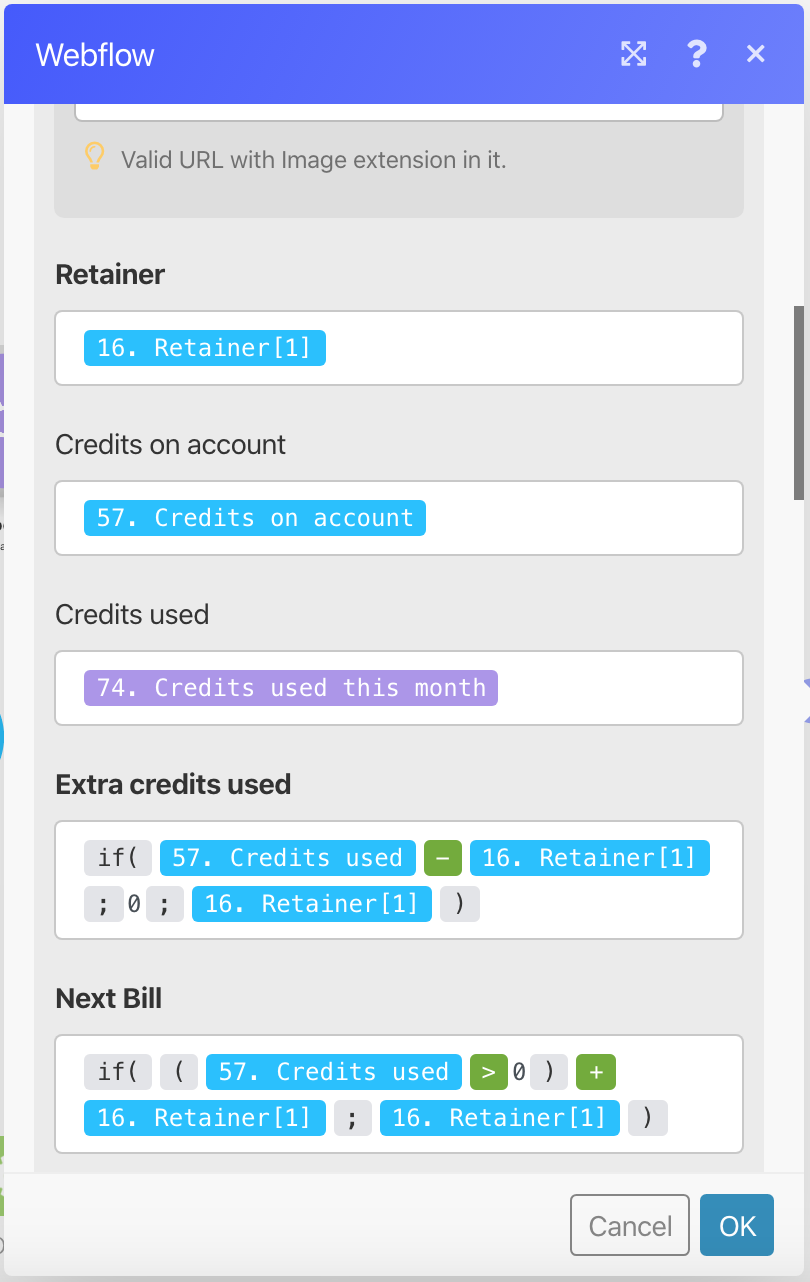
[Retainer]
[Credits on account]
[Credits used]
[Extra credits used]
[Next Bill]
[Airtable URL]
[Donut chart data]
It’s generally a good idea to populate all these fields with dummy data just so you can see how it will be displayed in your dashboard when working on it.
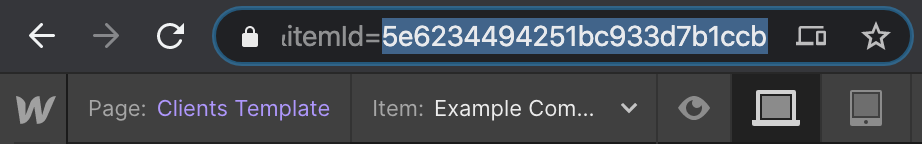
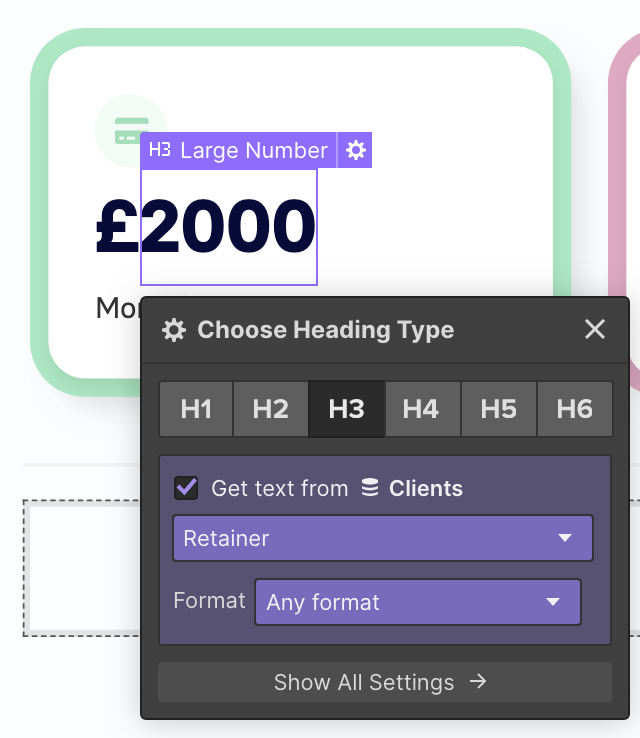
Now we have our first client dashboard, we also have the item ID of the CMS item which we can now put back into Airtable as our Client ID.
The data you have for each client can now easily be dynamically inserted into different parts of the dashboard like this.
Part 4. - Integromat
If you’ve heard of Zapier, it’s now time to be introduced to it’s cousin that might not be as popular, but a far more intellectual conversation holder.
Integromat operates in a very similar way to Zapier, using zaps or ‘Scenarios’ that are triggered by different events. The main difference I have found (which makes it way more exciting) is it’s seamless tools which allow you to compile and aggregate data in a formulaic way that can be used later on in the sequence. It’s a bit of a learning curve but one that I have undergone and must say is worthwhile.
In Part 1 of this process, when we created the ‘Tasks’ table in Airtable, we created a column for:
[Date Modified] - Last time any column in the row was updated
This is what we will use as our trigger in Integromat.
In this example; we will only charge clients for work at the end of the month, and when it meets the criteria of - Task Status = ‘Done’. This is important as we now need to create a new view of the ‘Tasks’ table called ‘Client Totals’ that displays all tasks filtered by:
• Invoice month - Whatever the current month is
• Task Status = Done
Note: I’s also really useful to hide any fields that aren’t relevant to keep things tidy and also to ‘Group by’ Client.
Now Integromat is ready to receive nice and tidy info from Airtable.

1. The trigger
[Airtable] - Watch Records
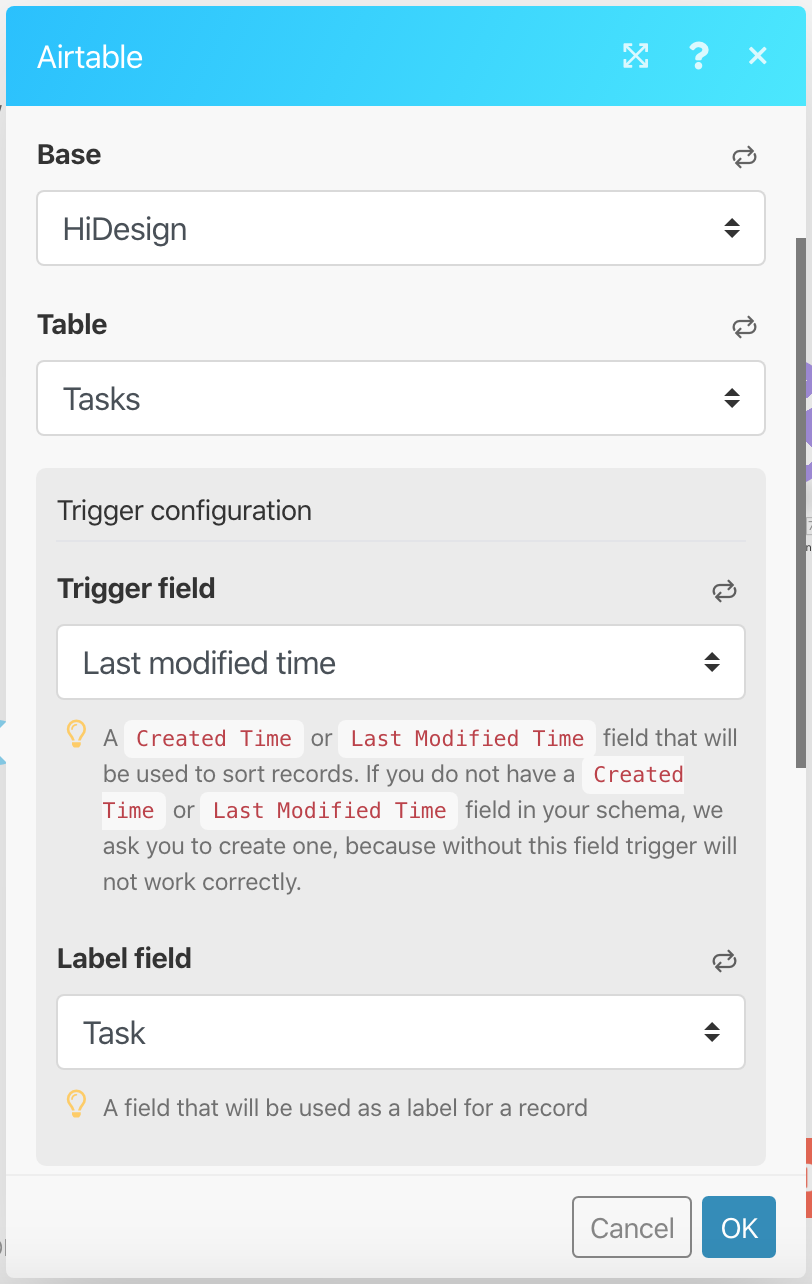
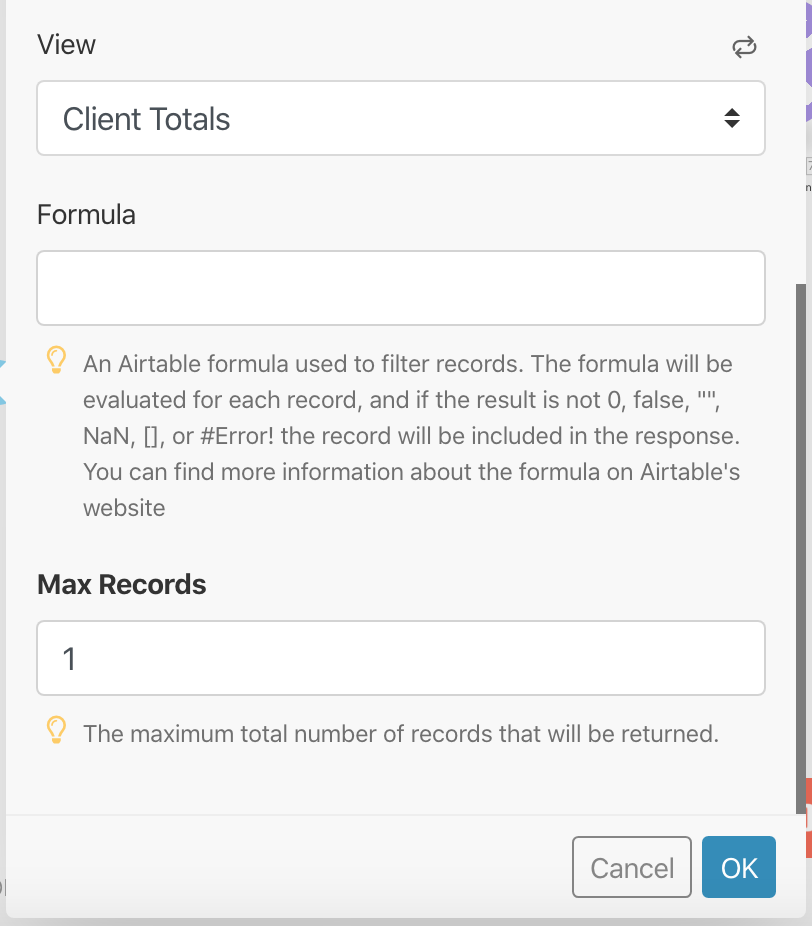
If you have named everything the same as us then here is what you should be setting the trigger to:
Table = Tasks
Trigger Field = Last Modified Time
Label Field = Task
View = Client Totals
Max Records = 1
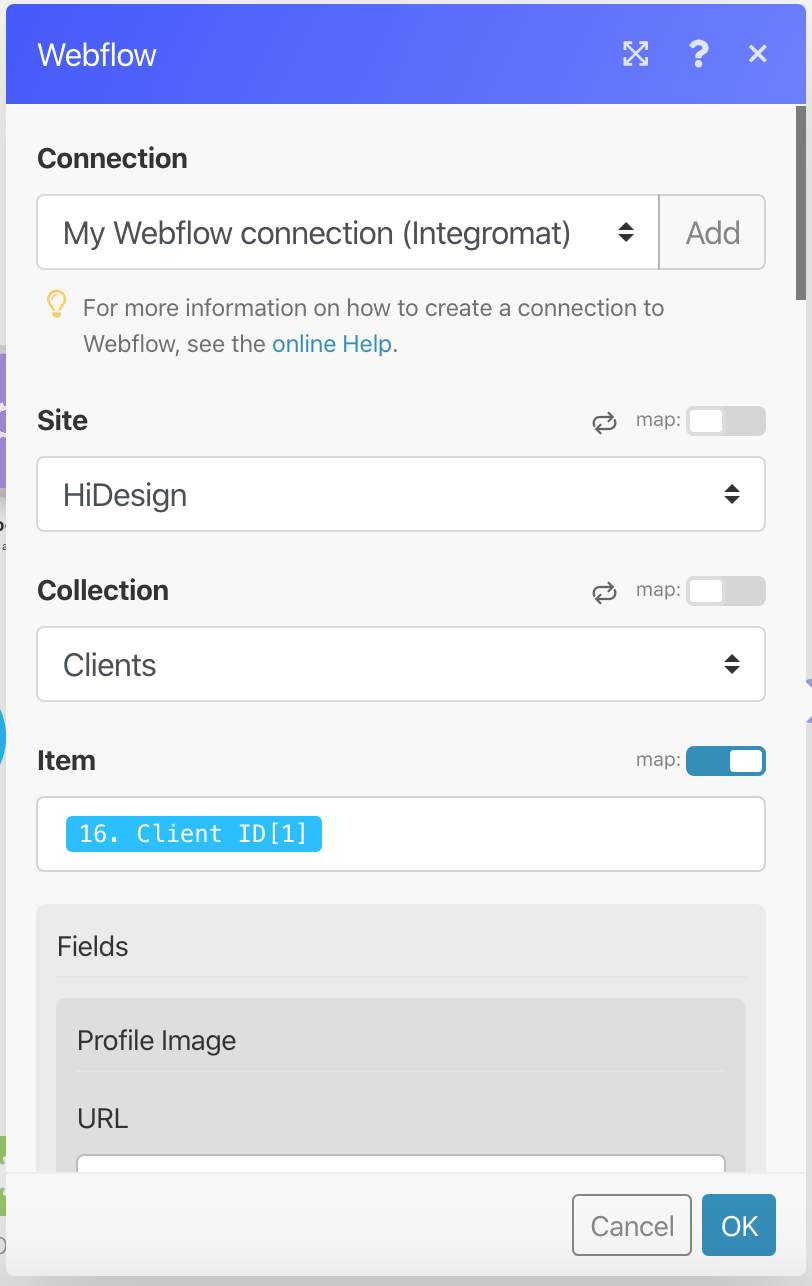
Now you can push the data to Webflow
By setting Item = Client ID, Airtable will always push the correct data to the corresponding Client CMS item.
Here are some examples of the data / formulas we run to display in the client dash.
Thanks for taking the time to read this article. If you get stuck please feel free to message me!


